Overview
mplstyle is a Python package, which allows matplotlib users to simplify the process of improving plots’ quality. Quite often font, size, legend, colors and other settings should be changed for making plots look better. Such changes can be remembered and stored in your own plot style, which can automatically change the way of making plots by importing it as a usual Python toolbox. In other words, with mplstyle you can set plotting settings once and use created configuration many times.
The core of mplstyle is a PLTbase class contained list of methods, which change initial settings of matplotlib. Figure 1 illustrates these changes by plotting several trigonometric functions with and without PLTbase.

Figure 1: Plotting changes by applying PLTbase class
All changes are distributed between three settings: color style, color order style and plt style. Each of them according to PLTbase has only one way of rewriting initial corresponding matplotlib setting. This way is called a default style. Figure 2 illustrates above mentioned PLTbase structure.
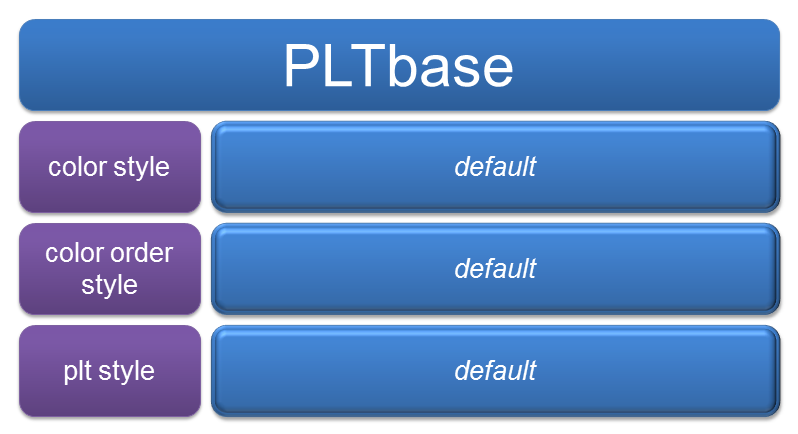
Figure 2: PLTbase class structure
Besides PLTbase there are five more classes: PLTdatabay, PLTdynamis, PLTenfo, PLTewk and PLTtz. Each class inherits functionality of PLTbase class and contains new other styles of reconfiguring initial settings. The structure of one of those classes is presented in the Figure 3.
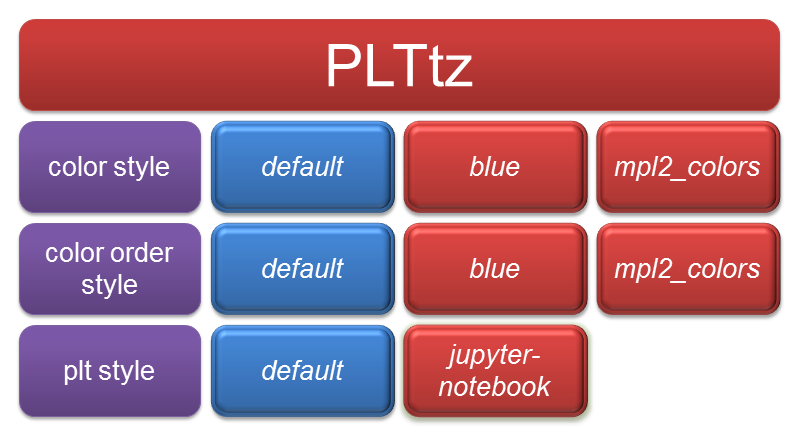
Figure 3: PLTtz class structure
As can be seen PLTtz keeps PLTbase styles and also contains additionals. Other four classes have exactly the same structure, but with their own additional styles. With mplstyle you can use already uploaded classes or create your own class.